Just like last year I will write a short post on how my blog has been doing goal and SEO wise in 2022 and compare it with 2021. A big difference between 2022 and 2021 is the amount of new posts I have made. In 2021 I made about 50 new posts and in 2022 I have made over 100 new posts. I think the quality of the posts I have made in 2022 has been poorer than I like, but that is what happens when you make a quantity goal and not a quality goal. Therefore I am going back to targeting 50 posts this year. Nonetheless the traffic on my blog has doubled from around ~12.000 a month to around ~25.000 visitors, we will see how the strategy pans out throughout this year (2023). The goal for 2023 is to have 50.000 visitors in one month and 500.000 total visitors for the year.
On the personal front, 2022 has been less eventful than 2021 and 2020, it has mostly been work, kids and losing money in the stock market! Even though 2023 may have a recession coming and the tech sector has tanking job wise, I still think 2023 can be a great year!
Now... let us look at some charts and numbers for my blog for 2022!
If we look at the top channels, it looks almost exactly like 2021:
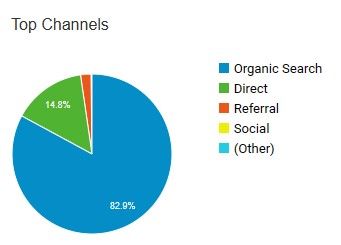
Organic is still ~82% of all traffic and likely much of the direct traffic is also organic traffic as I still do not promote my site very much. I tried social media with a twitter account but I have not used it that much. Overall I hardly post anything anywhere and people just find my site through Google and maybe Bing.
The amount of visitors is in line with 2021, after thanksgiving it starts to drop and it just grows throughout the whole year:
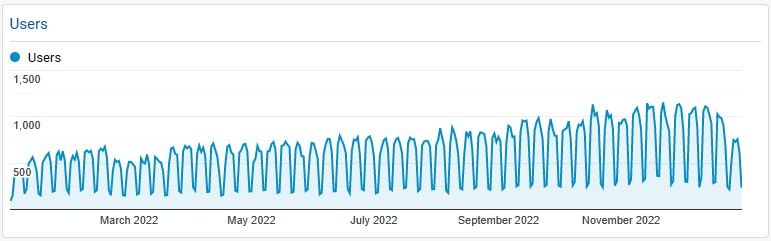
There was a small bump in traffic in February-March, I never figured out what exactly it was, maybe it was a search algorithm update. I had 212.561 visitors (Organic + referral + social) in 2022 and 99.837 in 2021 which is a 112% increase. This also means that I had ~582 visitors on average every day. I expect to do another ~100% next year - hoping for half a million of visitors.
Looking at devices for 2022, not much has changed:
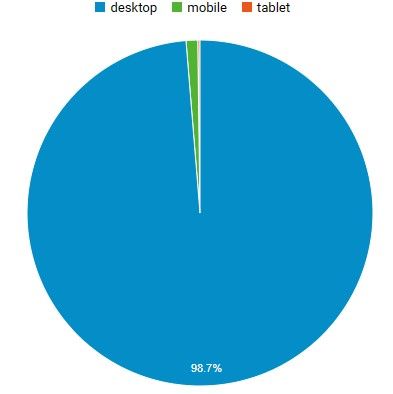
1.1% of my users use a phone to view my site and 0.2% use a tablet. I will reiterate my previous comments for this, the site is OK for mobile, but I spend very little time optimising for it, as that is not where my users are. Let us move on to browser statistics:
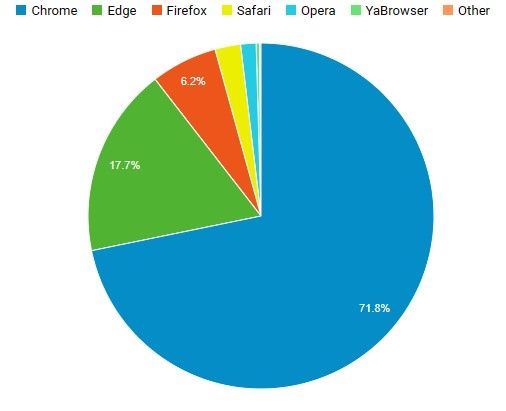
In the above we can see that Chrome is getting more popular again. In 2021 Chrome was at 61.1% and in 2022 it was at 71.8%, this seems to have been at the cost of all other browsers - especially Edge. These days most browsers are webkit based, so it matters less which browsers our users use.
There are also no surprises in the countries where my visitors are:
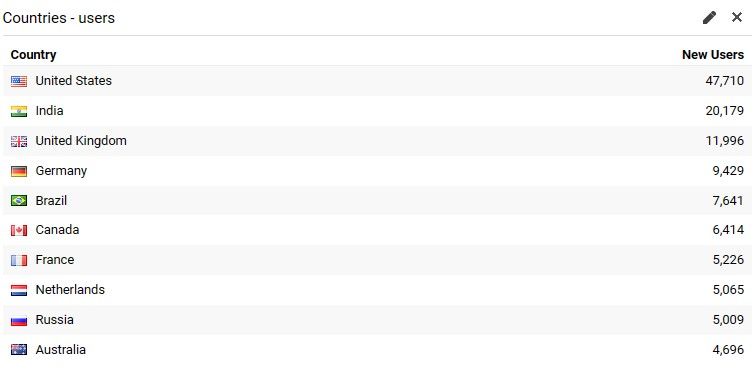
The US and India are still the biggest, I believe the biggest change from last year is that Brazil is climbing!
I also made a post on my top 5 posts of 2022, you can find it here.
That is all
I hope you enjoy these updates as much as me. I like being transparent and showing how well my blog is doing. I started it late in 2016 and I spend a couple of hours every week on it, but some months are much lower, in December I spent around spent 6 hours in total. So it is small increments that have gotten the blog to where it is.
We will see what 2023 brings!